About the Rejection Trend Report
This report is useful for viewing the rejection trends over time as opposed to looking at the details of a specific point in time.
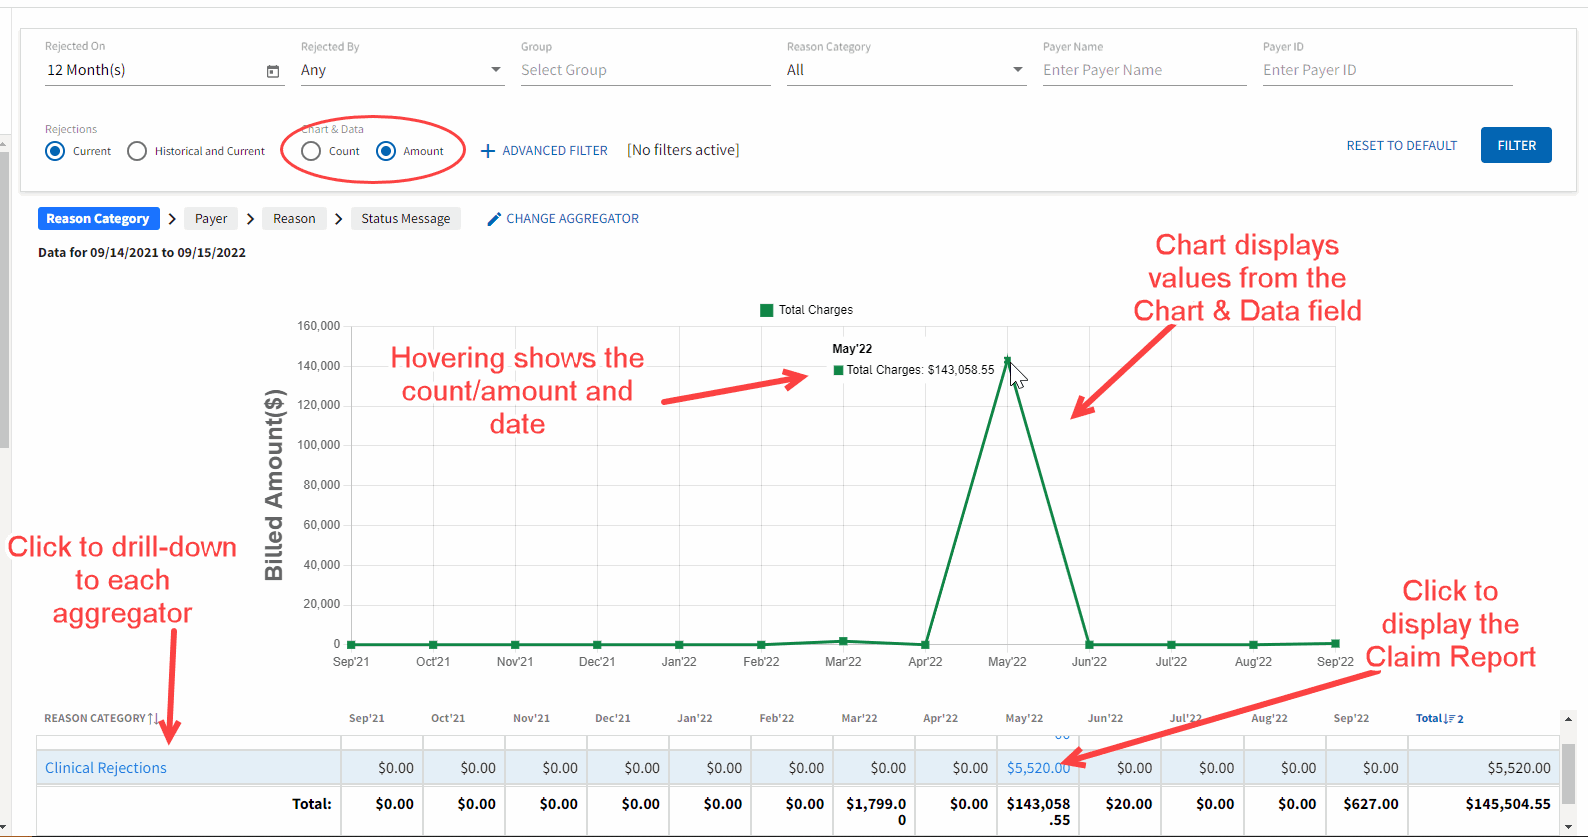
The Rejection Trend report is a drill-down report displaying the count of rejections, by category over a rolling twelve month period in a trend graph and grid. Data for the last twelve months displays by default. It lets you drill down into the aggregators to identify clinical and eligibility denials and help identify areas of improvement for your organization. You have the option of filtering on the reporting period by week or month. The report is broken into two sections, a graphical view and a grid view. The chart and grid views display data based on the Chart & Data filter field. The options are by count or amount. The default is count. The chart displays a green line showing the total count/amount when hovering over the square on the line.
The grid view also displays data based on the Chart & Data field and the selected aggregators and lets you drill-down to each aggregator. Clicking on a hyperlink value in the week/month column displays the Claim Report.
