
About Clean Claim Reports
The Clean Claim report displays the percentage of claims passing EDI edits, those in a current status of accepted or acknowledged. The Clean Claim Trend report compliments the Clean Claim report by displaying clean claim rate trends in a graphical line format.
Clean Claim Report
A clean claim is a claim with no defect or impropriety, no lack of required substantiating documentation or no circumstance requiring special treatment that prevents timely payment. The current status of a claim is calculated by dividing the number of claims passing all edits without manual intervention by the total number of claims accepted into a claims processing tool for billing ((ACC + ACK) / (ACC +ACK + REJ)). Claims with a status of Pending or Completed are excluded from the calculation.
The table below shows fields, filters and columns for both prior versions and updates made for 12.8 to aid in understanding what has changed.
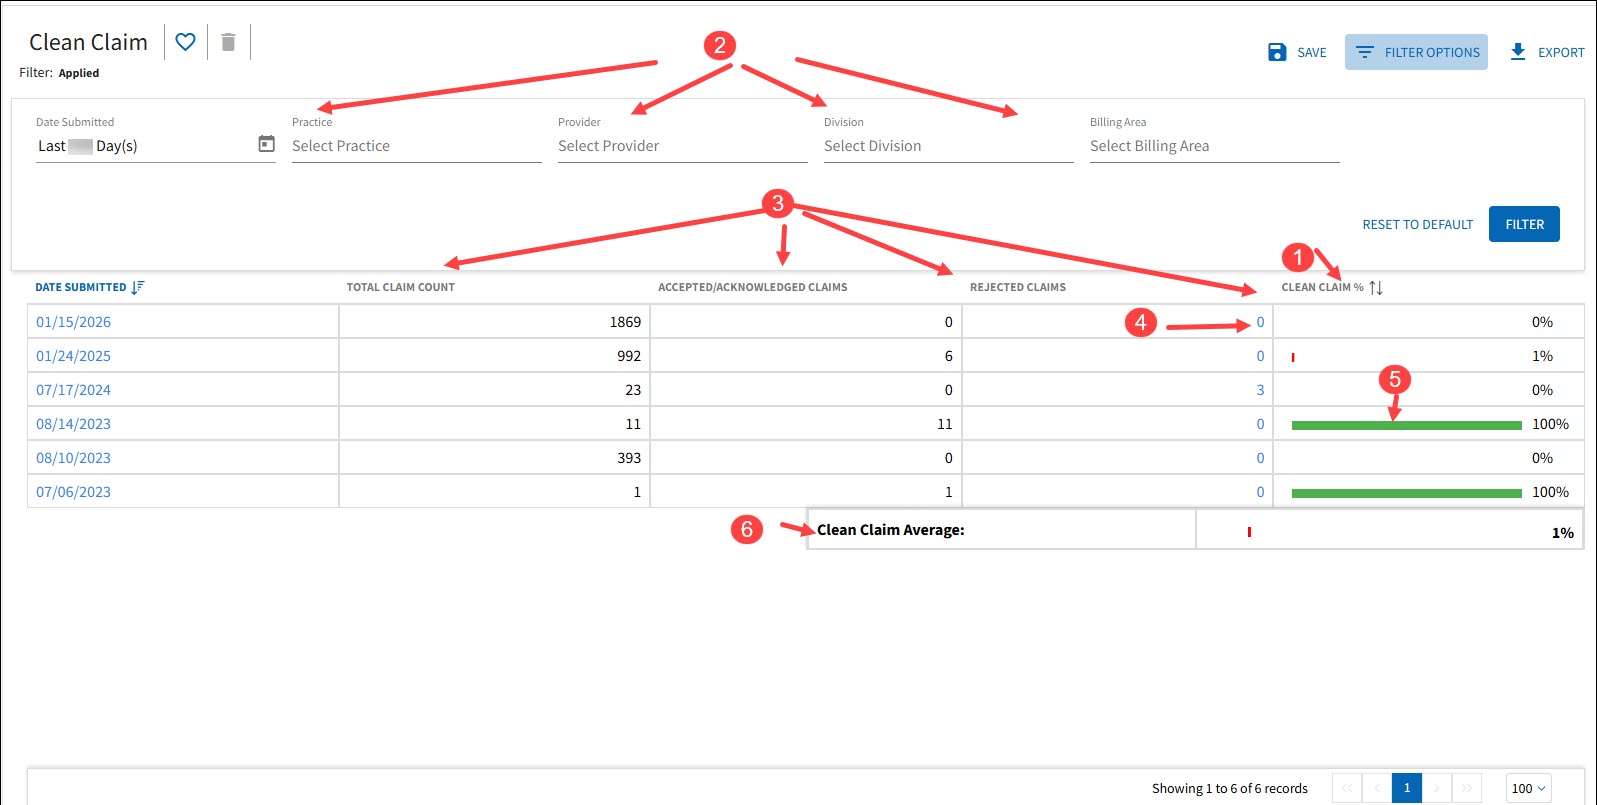
| Number | Field | Prior to v12.8 Description | v12.8 Description |
|---|---|---|---|
| 1 | Calculation (for current status) |
CURRENT STATUS = (ACC + ACK) / ALL STATUSES*
*PENDING *ACKNOWLEDGED *ACCEPTED *REJECTED *COMPLETED) |
CURRENT STATUS = ((ACC + ACK) / (ACC + ACK +REJ) *Claims with CURR status = PENDING or COMPLETED are excluded from the calculation |
| 2 | Filters |
| N/A |
| 3 | UI Columns/Grid |
|
|
| 4 | Drill Down/Hyperlink | Run Summary |
Rejected Claims Drills to Claims > Rejected Claim report with filters |
| 5 | Color Bar |
| N/A |
| 6 | Clean Claim Average |
CALC= Average of Averages | CALC= Average of the data set Refreshed on filter *Average of Averages is discontinued* |
| N/A | Dashboard Quick Link | Displays global CCR for default 90 days | Updated to revised calculation |
Clean Claim Trend Report
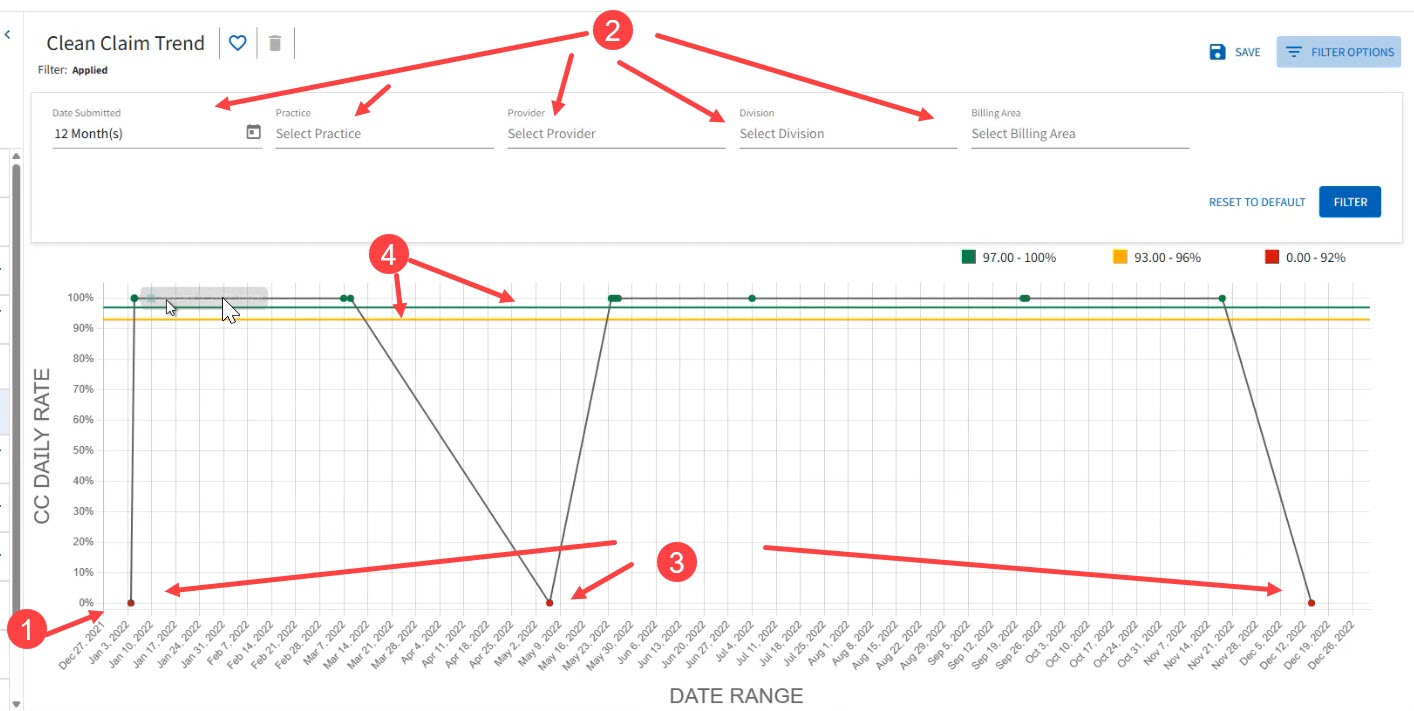
This trending report displays data points representing the clean claim rate by day. The x-axis is labeled for each week beginning on Monday. Upon hover over data points a ToolTip displays the specific date and percentage.
| Number | Field | Prior to v12.8 Description | v12.8 Description |
|---|---|---|---|
| 1 | Date Range (X-axis) | N/A | 0 count days removed |
| 2 | Trend Filters | Date Submitted – Last 90 Days (default) |
|
| 3 | Data Points |
| N/A |
| 4 | Benchmarks | N/A | Added EDI defined benchmarks to the graph to indicate how claims are trending (at,above or below the thresholds). |