About Remit Trend Report
The Remit Trend report is a drill-down report displaying remits received by payer in a trend graph and grid. This report is useful for viewing remit trends over time as opposed to looking at the details of a specific point in time.
The Remit Trend report is a drill-down report displaying remits received by payer in the previous calendar month in a trend graph and grid. Data for the last twelve months displays by default. It lets you drill down into the aggregators to help identify areas of improvement for an organization. It helps to identify clinical denials and eligibility denials, as well as areas where underpayments might be occurring.
You have the option of filtering on the reporting period by week or month.
The report is broken into two sections, a graphical view and a grid view.
- All
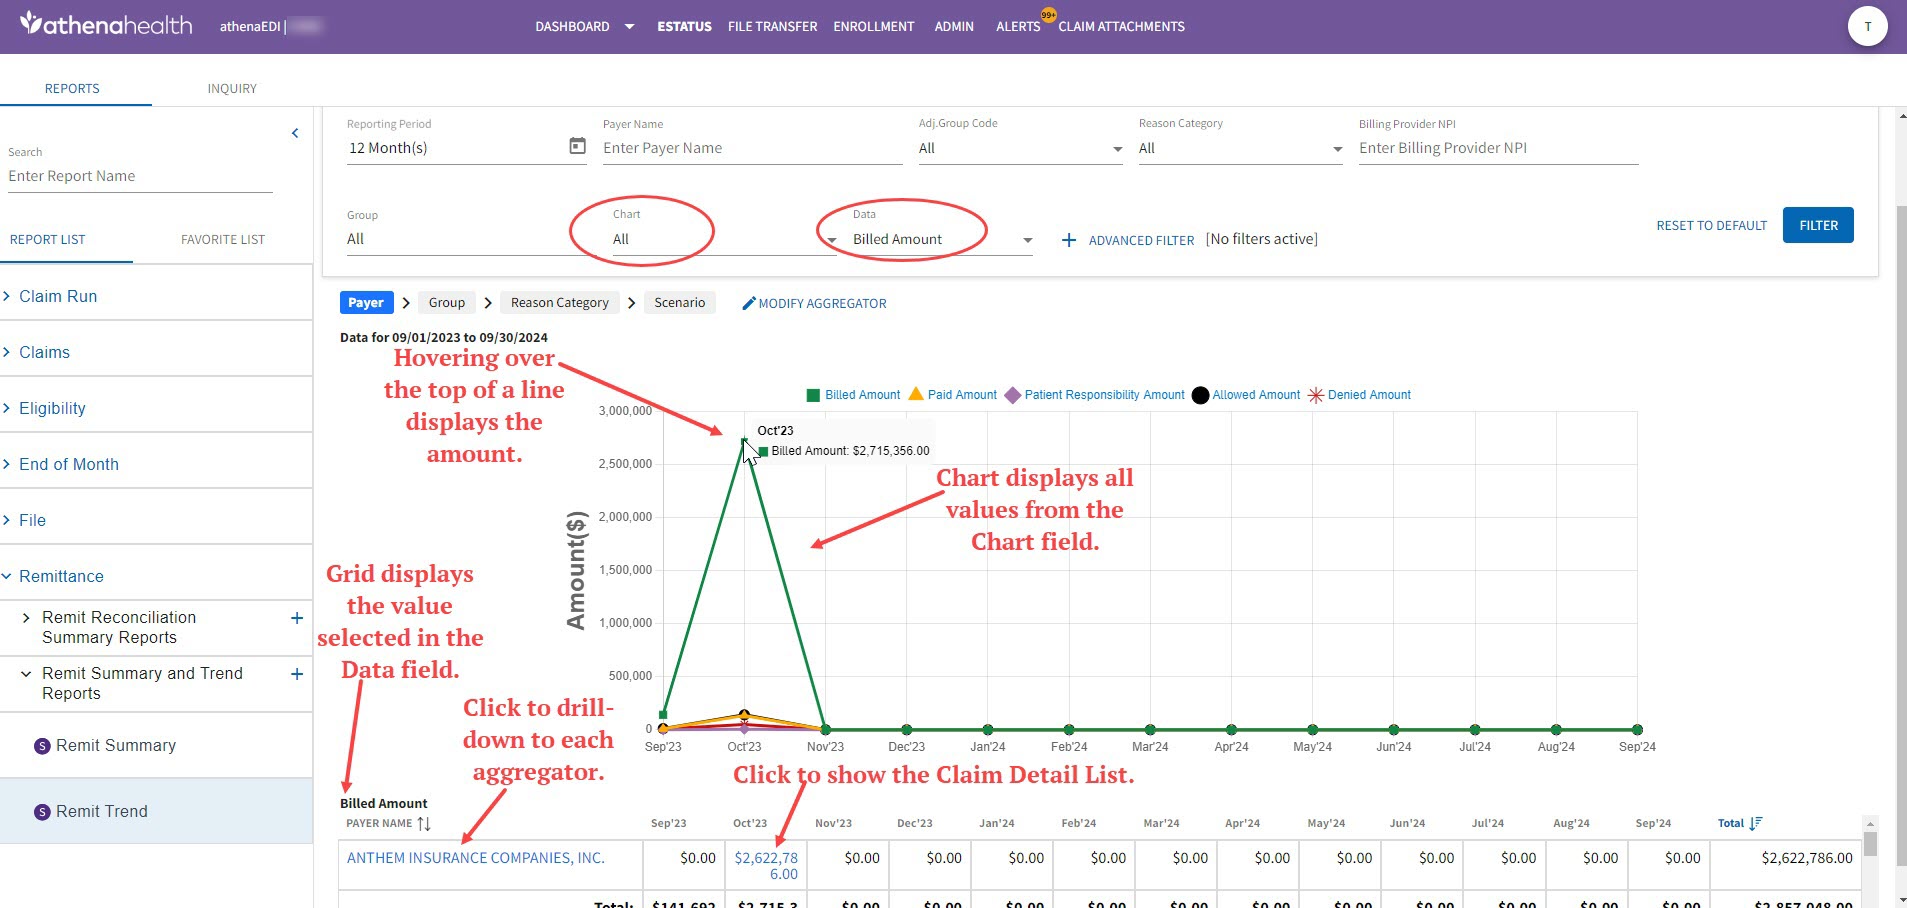
- Billed Amount (green line)
- Paid Amount (orange line)
- Patient Responsibility Amount (purple line)
- Allowed Amount (black)
- Denied Amount (red line)
Hovering over the tip of any of the chart lines displays the month and total dollar amounts .
- Billed Amount
- Paid Amount
- Patient Responsibility Amount
- Allowed Amount
- Denied Amount
The grid view displays data based on the Data filter field and corresponds with the chart data. For example, if you select All in the Chart field, and Billed Amount in the Data field, the chart displays all values and the grid displays only the Billed Amount.
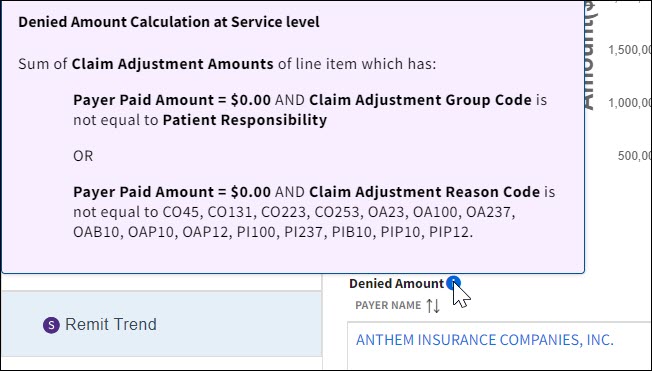
When Denied Amount is selected from the Data field hovering over the Denied Amount tooltip in the grid displays the calculation of the amount.