About the Eligibility Dashboard
The Eligibility Dashboard displays transaction status data in graphical format.
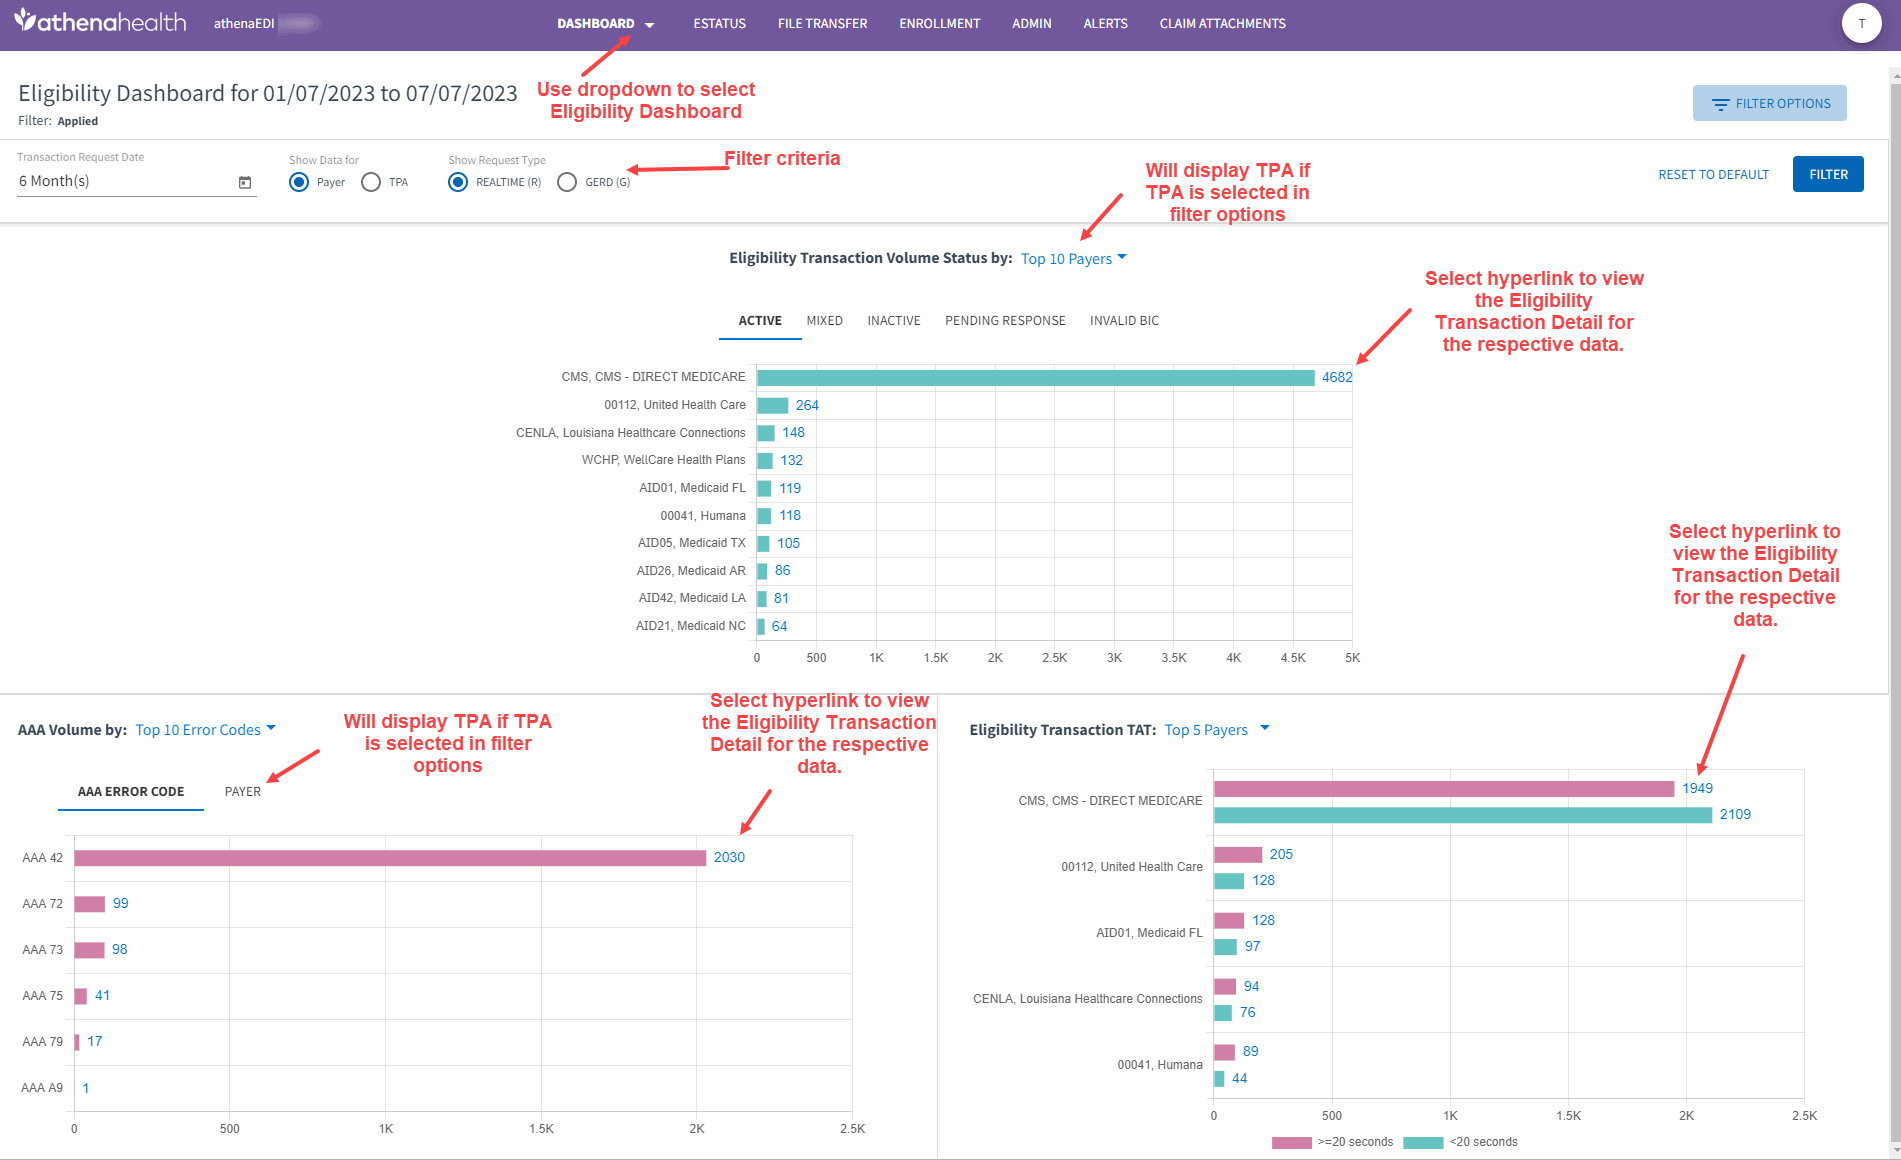
The Eligibility Dashboard is available from the Dashboard tab drop-down. The Eligibility Dashboard shows the status breakdown of transactions sent during a specific time period. By default the filter criteria is for transactions reported in the last 12 hours, by Payer, and a transaction type of Realtime.
The upper dashboard displays a bar graph of eligibility transaction volume by status (Active, Mixed, Inactive, Pending Response, and Invalid BIC) with the option of showing the data by the top 5, 10, 15, 20 and 25 Payers or TPA depending upon the filter criteria selected. By default data displays for Active status. Selecting any of the statuses displays data for the selected status. Selecting the hyperlink total (in blue) displays the Eligibility Transaction Detail for that payer and date range.
The bottom left of the dashboard displays AAA volume by error codes in graphical format with the option of displaying data for the top 5, 10, 15, 20, or 25 error codes. You can display the data by AAA error code or by Payer/TPA (depending on the filter criteria was selected).
The bottom right displays eligibility transaction TAT with the option of displaying data for the top 5, 10, 15, 20, or 25 Payers/TPA. Depending upon the filter criteria selected the pink and green bars reflect the following:
For Realtime Request Type:
-
Pink Bar - transactions that took >= 20 seconds.
-
Green Bar - transaction that took < 20 seconds.
For Gerd:
-
Pink Bar - transaction that took >= 4 hours.
- Green Bar - transaction that took < 4 hours
